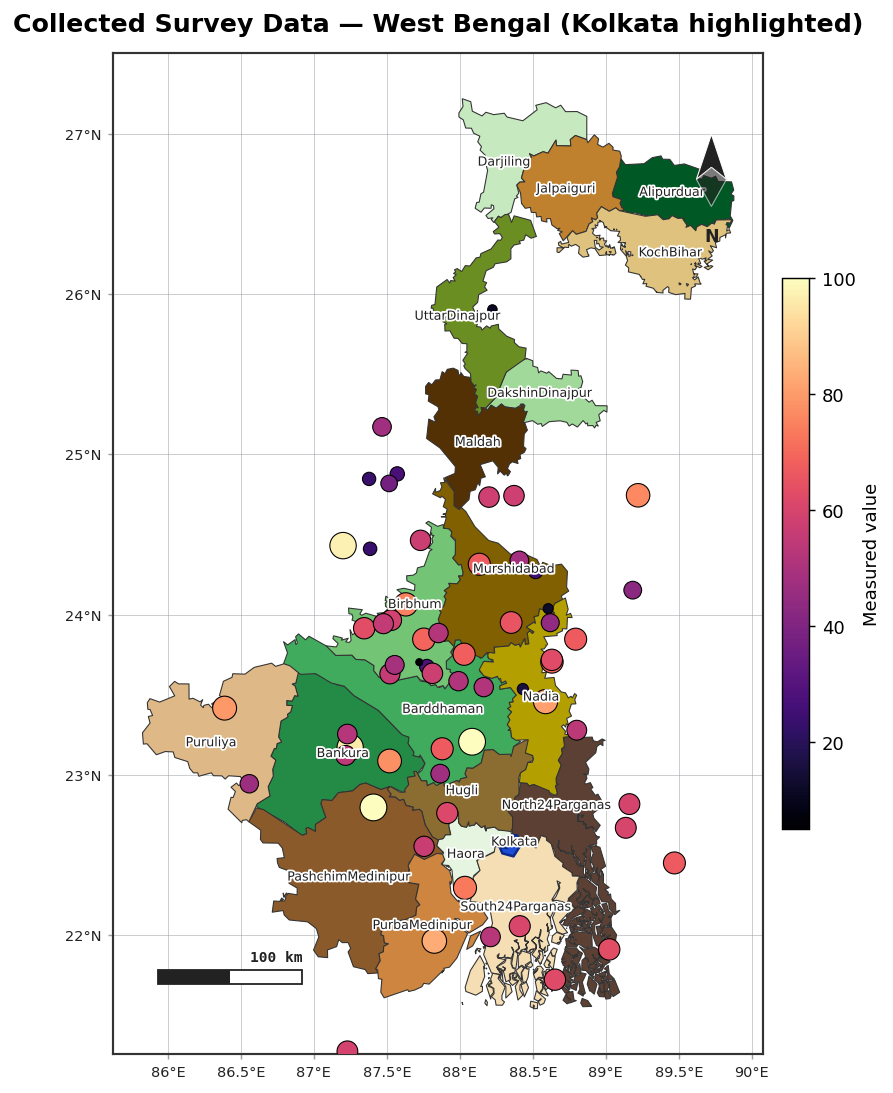
Collected data points
points() overlays site markers — capital cities, study sites, sampling locations — onto an
existing map, with optional labels and graduated symbols for collected data.
import acadgis as agis

gdf = agis.load_boundaries("India", "state", within="West Bengal")
ax = agis.plot(gdf, palette="pastel")
agis.points(ax, survey_df, value="value", size_by="value",
            cmap="magma", legend=True)
agis.show()
Input formats
points() accepts a DataFrame, a dict, or a list of records. Coordinates can be lon/lat
columns or a geometry column:
agis.points(ax, {"name": ["Kolkata"], "lon": [88.36], "lat": [22.57]})

survey_df = agis.pd.DataFrame({
    "name":  ["S1", "S2", "S3"],
    "lon":   [88.3, 88.5, 88.1],
    "lat":   [22.6, 22.4, 22.9],
    "value": [12, 45, 7],
})
agis.points(ax, survey_df, value="value", size_by="value")
Graduated symbols
Two independent encodings make a classic collected-data map:
value=— colour each marker by a column, with a colorbar.size_by=— scale the marker area proportionally to a column.
Labels
Combining with everything else
points() draws onto any axes returned by plot(), choropleth() or relief(), so you can
layer collected data over a choropleth or terrain map: