Choropleths & name matching
choropleth() joins a data table to boundary polygons and shades them by value — handling the
single most annoying part of the job, name mismatches, for you.
import acadgis as agis
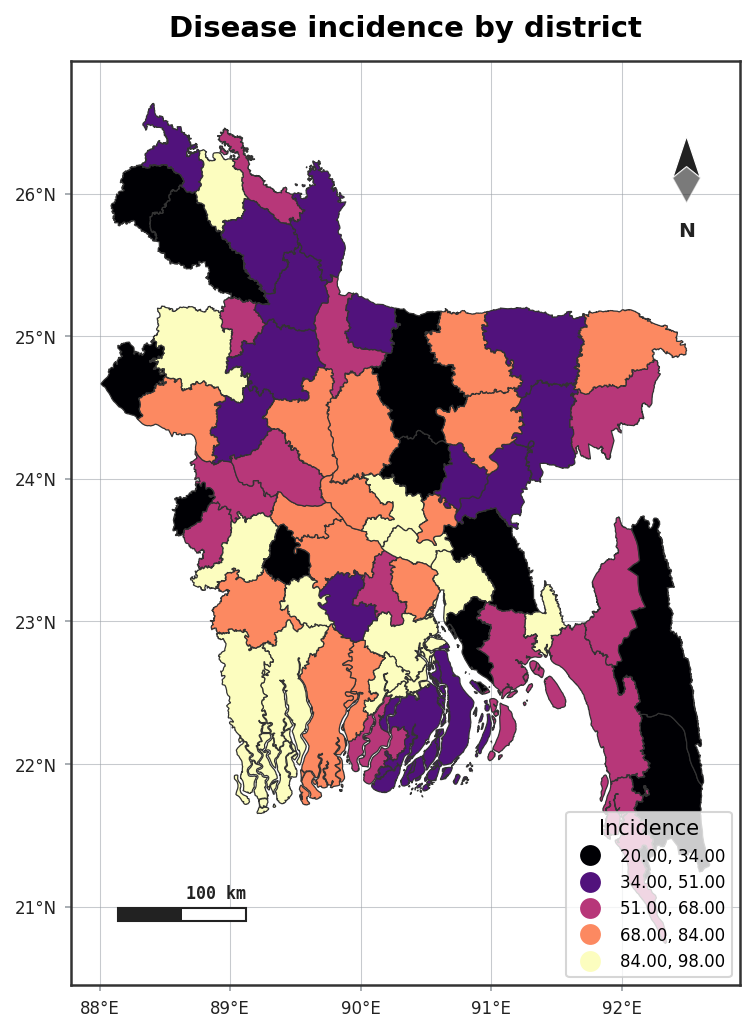
gdf = agis.load_boundaries("Bangladesh", "district")
agis.choropleth(gdf, df, value="incidence", palette="magma")
Automatic fuzzy name matching
Your spreadsheet rarely spells region names exactly like the boundary file. AcadGIS matches them automatically, tolerating:
- renames — Chittagong ↔ Chattogram
- dropped admin suffixes — Comilla District ↔ Comilla
- diacritics and case — Bogra ↔ Bogura
df = agis.pd.DataFrame({
    "name":  ["Chittagong", "Comilla District", "Dhaka"],
    "incidence": [42, 31, 58],
})
agis.choropleth(gdf, df, value="incidence")
By default the join key is inferred; pass it explicitly when needed:
Install the matcher
Fuzzy matching uses rapidfuzz: pip install "acadgis[match]". Without it, AcadGIS falls
back to exact matching.
Classification schemes
Pass any mapclassify scheme to bin continuous values:
Common schemes: natural_breaks, quantiles, equal_interval, std_mean.
Styling
choropleth() shares the decoration system with plot():
agis.choropleth(
    gdf, df, value="incidence",
    palette="magma", scheme="quantiles",
    title="Incidence by district",
    legend=True, north_arrow=True, scale_bar=True,
)
agis.save("incidence.pdf", dpi=300)
Checking the match
When a row can't be matched it is reported so nothing fails silently — review the warning and fix the offending name or add it to your table.